

Anthropometry for Equestrian
Is body size and composition (anthropometry) important for the equestrian rider? Although the horse does a fair amount of the physical work, the rider also needs a certain amount of fitness, and body size can affect balance and coordination on the horse.
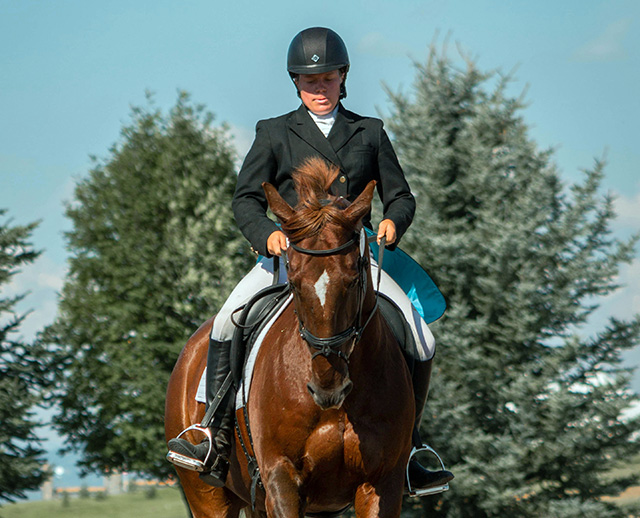 body size and composition is important for the equestrian rider
Anthropometry and Olympic Athletes
London 2012 Olympic Games
Here is some information from the analysis of the anthropometric data (height, weight and age) from the equestrian participants at the London 2012 Olympic Games.
The equestrian riders are not surprisingly older than the average Olympian, having the highest average of all sports. Height and weight are a little lower than the average Olympic athlete.
| Sport | Age | Height (cm) | Weight (kg) | BMI |
|---|---|---|---|---|
| OVERALL AVERAGE (all sports) | 26.1 | 176.9 | 72.8 | 23.3 |
| Equestrian (all) | 37.9 | 174.4 | 67.2 | 22.0 |
| Equestrian (females) | 36.1 | 168.8 | 59.5 | 20.9 |
| Equestrian (males) | 39.0 | 178.1 | 72.4 | 22.8 |
Rio 2016 Olympic Games
Here is average data from the analysis of the anthropometric data of the equestrian competitors at the Rio 2016 Olympic Games.
| Age (years) | height (m) | weight (kg) | BMI | |
|---|---|---|---|---|
| AVERAGE (all sports) | 26.8 | 1.77 | 72.0 | 22.9 |
| equestrian (all) | 37.8 | 1.75 | 67.5 | 22.0 |
| equestrian (females) | 36.9 | 1.68 | 58.6 | 20.7 |
| equestrian (males) | 38.3 | 1.79 | 73.0 | 22.8 |
Related Pages
- Olympic Games Anthropometry for other sports in 2012
- All about fitness testing, including anthropometry testing
- Equestrian Polls
 Upcoming Events